Istio - 可观察性
Grafana
Grafana 是一款开源的指标数据可视化工具,有着功能齐全的度量仪表盘、图表等时序数据展示面板,支持 Zabbix、InfluentDB、Prometheus、Elasticsearch、MySQL 等数据源的指标展示,详情查看:Grafana 支持的数据源类型 (opens new window)。
在 Istio中,也引入了 Grafana 这样一款提供了将时间序列数据库(TSDB)数据转换为精美的图形和可视化面板的工具。Grafana 让用户能够更直观地观测到集群中各项数据指标的变化趋势(网格流量变化、组件资源使用情况等),是 Isito 实现可观测性最重要的组件之一。
Grafana 的使用和配置
#想要在浏览器中访问 Grafana 主页,可以将 Grafana 的 service 设置为 NodePort类型
[root@iZuf61kbf845xt6tz10abgZ networking]# kubectl get service grafana -n istio-system
NAME      TYPE        CLUSTER-IP    EXTERNAL-IP   PORT(S)    AGE
grafana   ClusterIP   10.1.186.43   <none>        3000/TCP   24h

#  type: ClusterIP 改成 type: NodePort                                         24h
[root@iZuf61kbf845xt6tz10abgZ networking]# kubectl edit service grafana -n istio-system
service/grafana edited

#  再次查看,默认给分配了一个外部访问端口30867
[root@iZuf61kbf845xt6tz10abgZ networking]# kubectl get service grafana -n istio-system
NAME      TYPE       CLUSTER-IP    EXTERNAL-IP   PORT(S)          AGE
grafana   NodePort   10.1.186.43   <none>        3000:30867/TCP   24h

# 同理修改prometheus的type: NodePort,然后配置Grafana网址添加prometheus的地址
[root@iZuf61kbf845xt6tz10abgZ networking]# kubectl edit service prometheus -n istio-system
service/prometheus edited
1
2
3
4
5
6
7
8
9
10
11
12
13
14
15
16
17
2
3
4
5
6
7
8
9
10
11
12
13
14
15
16
17
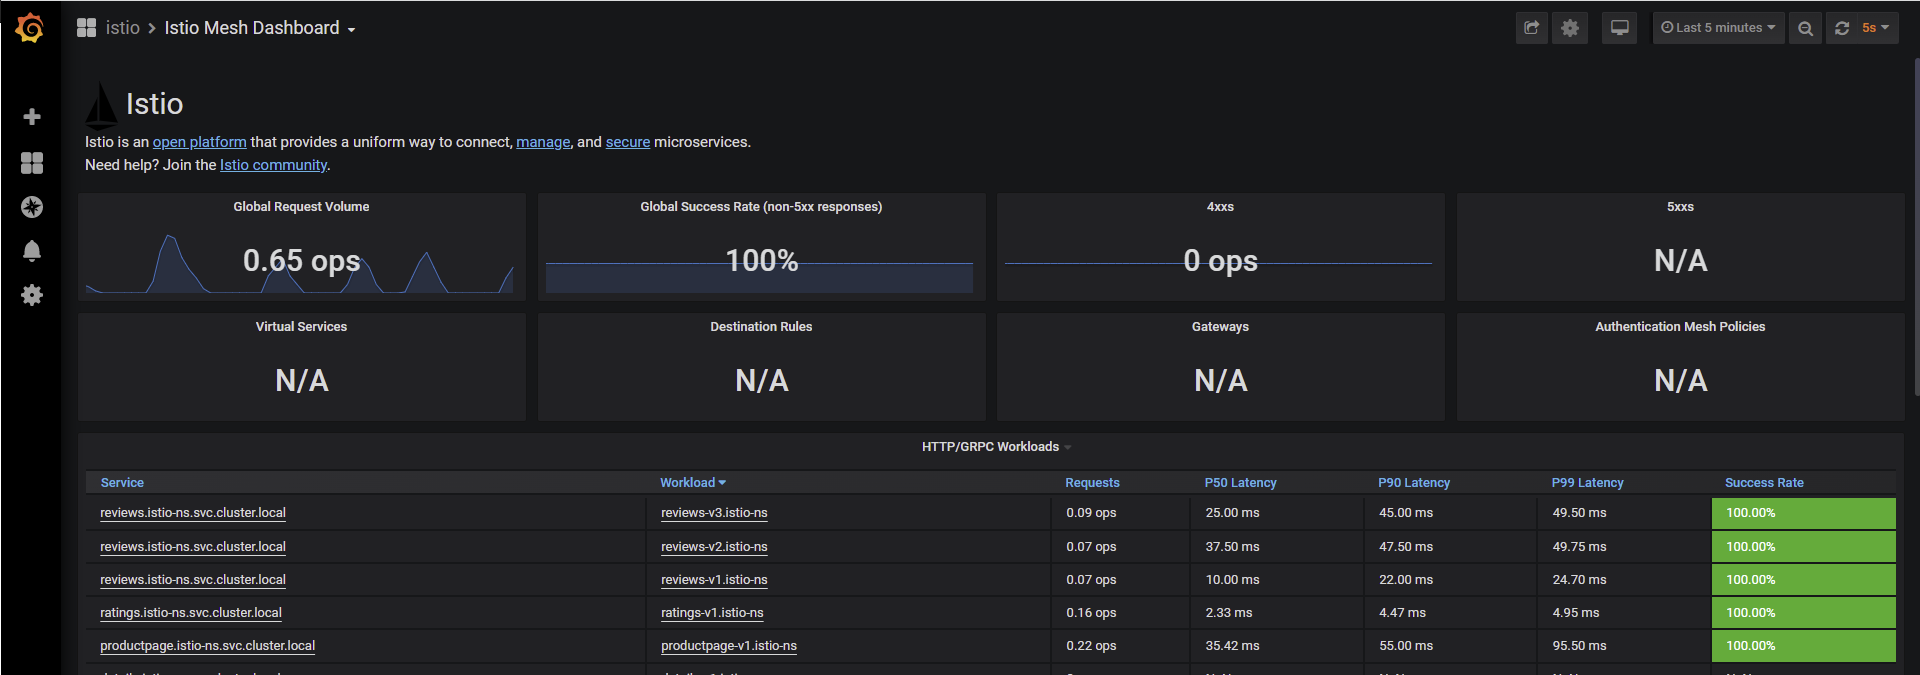
仪表盘
- Istio Citadel Dashboard
- Istio Galley Dashboard
- Istio Mesh Dashboard
- Istio Mixer Dashboard
- Istio Performance Dashboard
- Istio Pilot Dashboard
- Istio Service Dashboard
- Istio Workload Dashboard
以 Istio (opens new window) 流量仪表盘为例,其可视化界面如下: